Calibrating phasesto the data
The textbook says fluorescein angiography has three fixed phases. I tested that against the data — and it did not hold.
Clinical literature describes fluorescein angiography in three phases — early, mid and late — and a case report gave concrete boundaries at roughly 47.5 and 197.5 seconds. The tempting move is to take those numbers and move on.
But a convention from one clinical context is a hypothesis, not a fact, for this dataset. So it was tested — with a measurement instrument built specifically for the question.
A one-dimensional LDA probe — cheap, and reusable.
A one-dimensional Linear Discriminant Analysis fitted on frozen embeddings, read through three metrics — balanced accuracy, distribution overlap, and the Fisher score. If a set of phase boundaries carves the data into genuinely distinct groups, the probe scores high. If the phases blur together, it scores low.
The convention did not survive contact with the data.
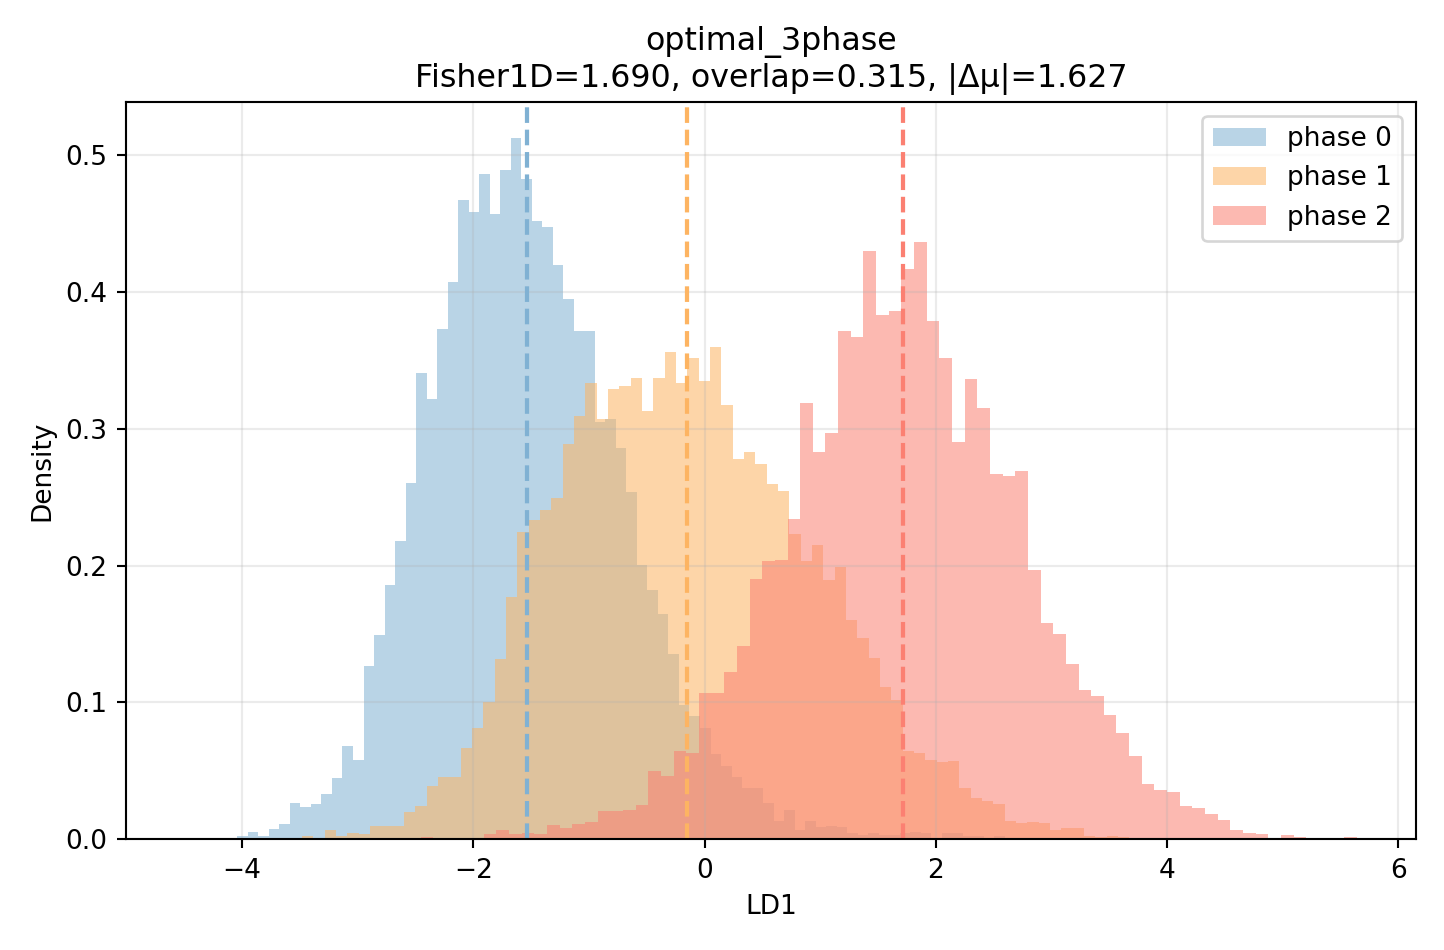
Phase boundaries should be calibrated to the data — not copied from a textbook.